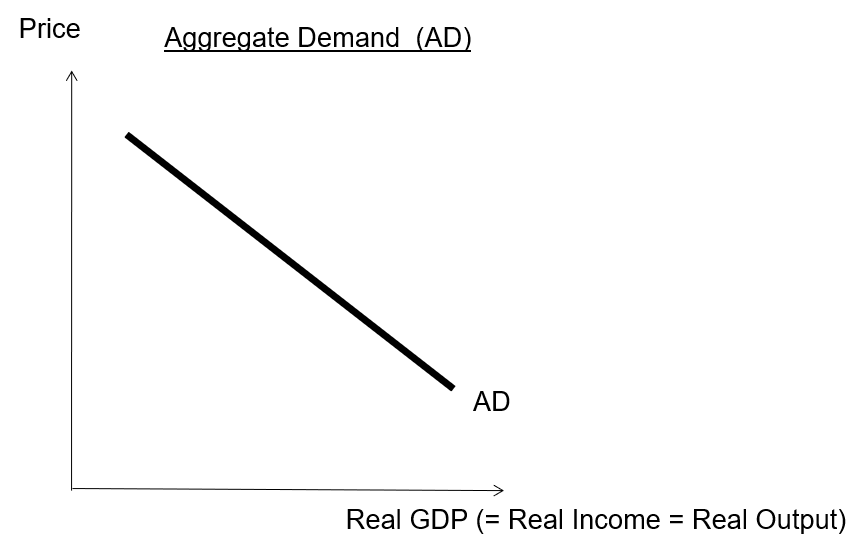
Aggregate demand (AD) is a schedule or curve that shows the various amounts of real domestic output that domestic and foreign buyers will desire to purchase at each possible price level.
To put it more simply, Aggregate Demand (AD) is a measure of how Real Gross Domestic Product (GDP) changes with the Average Price of Output . It measures how ‘Household Consumption’ (C), ‘Private /Firm Investment’ (I), ‘Government Spending’ (G), and ‘Net Exports of domestic goods purchased by foreigners’ (NX) changes with Price.
As Real GDP is a function of C + I + G + NX, it can vary depending on the price level of those goods and services. Aggregate Demand (AD) reflects this Real GDP level, and relates how it varies with different prices. Real GDP represents the total amount of goods and services produced in an economy over the long term, while Aggregate Demand (AD) is the demand for those goods and services at a specific point in time. In the short run, real GDP may be different from the Aggregate Demand (AD), but both will converge in the long run. However for simplicity, given that both Aggregate Demand (AD) and real GDP captures the same thing mathematically, we can treat them as one and the same.
Slope of the AD Curve
The Aggregate Demand (AD) curve is downward sloping, indicating that at higher prices, there will be less goods and services demanded, leading to lower level of national output.
There are three main factors affecting the slope of the Aggregate Demand (AD) curve, and these are namely:
Foreign Sector Substitution Effect;
Interest Rate Effect;
Wealth Effect
#1 Foreign sector substitution effect
If prices of goods and services in domestic market increase, consumers tend to look for cheaper sources produced in other markets. On the other hand, if domestically produced goods and services are cheaper than foreign ones, there will be more demand for these cheaper goods and services. In summary:
Higher Prices, Lower Real GDP;
Lower Prices, Higher Real GDP
#2 Interest Rate Effect
If prices of goods and services (especially for expensive items such as education, car, house and etc) increases, consumers may need to borrow more money to purchase them. The increase in demand for loans will lead to an increase in interest rate (cost of borrowing), which in turn will lower private investment by firms (I) & household consumption (C). In summary:
Higher Prices, Lower Real GDP
Lower Prices, Higher Real GDP
#3 Wealth Effect
If prices of goods and services increase, the purchasing power of wealth and savings will fall. That is, your assets such as stocks, bonds, savings, and cash have less value as they can purchase less goods & services. That is another way of saying that your Real GDP will fall. In summary:
Higher Price, Less Real GDP
Lower Price, Higher Real GDP
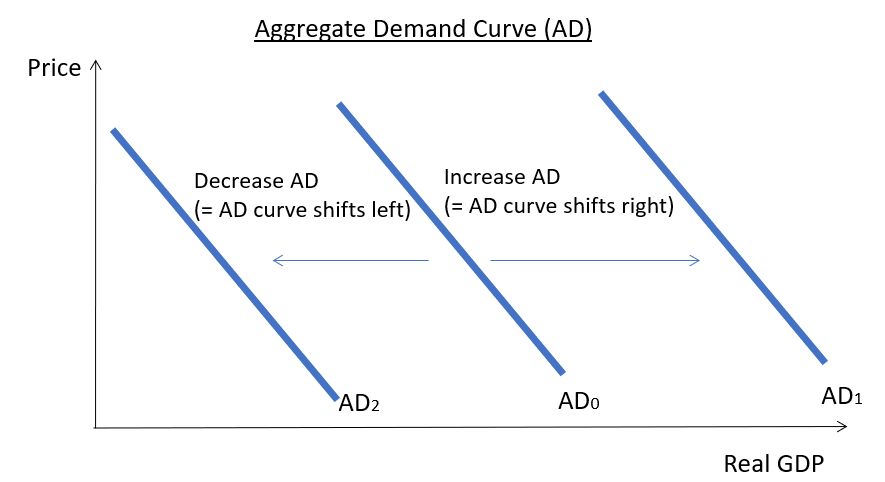
Position of the AD Curve
What are the factors that can affect the position of the Aggregate Demand (AD) curve?
Mathematically, Aggregate Demand (AD) = C + I + G + NX. Hence, if any of these components increase, the AD curve will correspondingly increase (i.e. AD shifts right). On the other hand, if these components decrease, the AD curve will also decrease (AD curve shifts left).
Next, let’s look at the Aggregate Supply (AS), and then learn how Aggregate Demand (AD) interacts with Aggregate Supply (AS). This AD-AS Modelcan help us understand what happens when an economy is in different business cycles.