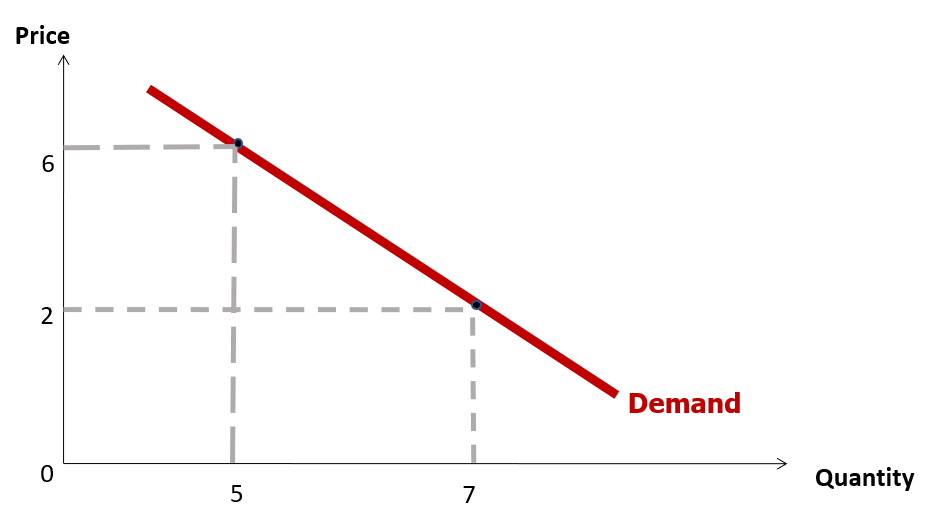
Demand can be defined as the desire to buy goods and services with the ability to pay. The demand curve is a graphical representation between the price of a good and the quantity demanded for a given period of time.
Based on the ‘Law of Demand’ which states that “holding all else equal, when the price of a good rises, consumers decrease their quantity demanded for that good”. Hence, at higher prices, consumer would be less wiling to buy, while at lower prices, consumers will increase the quantity purchased. Inherently, this gives us a downward sloping demand curve.
The foundation for the law of demand
There are 2 main effects that take place behind the scene that lays the foundation for the law of demand:
The income effect: When the price of a good falls, people will be able to buy more even if their income has not changed.
The substitution effect: The good will now be cheaper compared to other goods. People will switch to consuming the cheaper good.
Taken together, these two effects can explain why the demand curve is downward sloping.
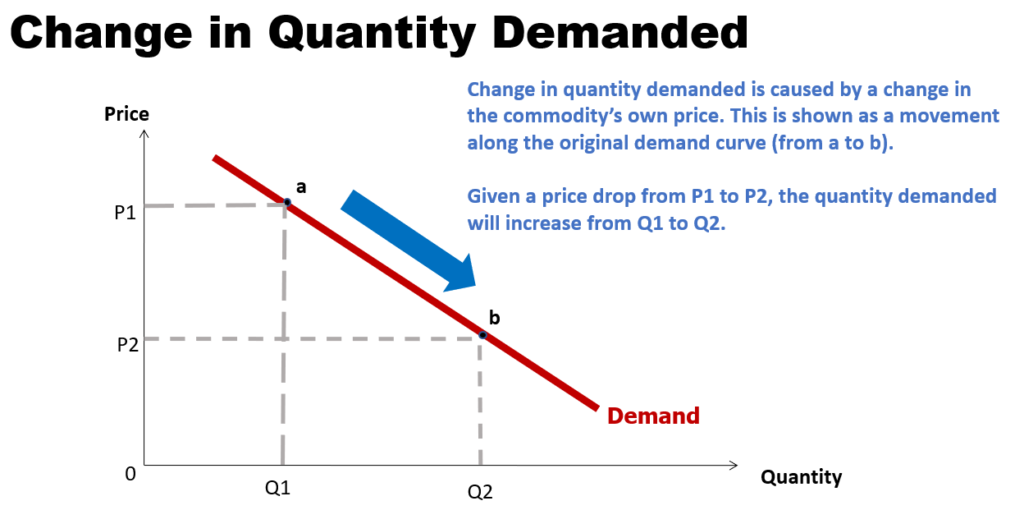
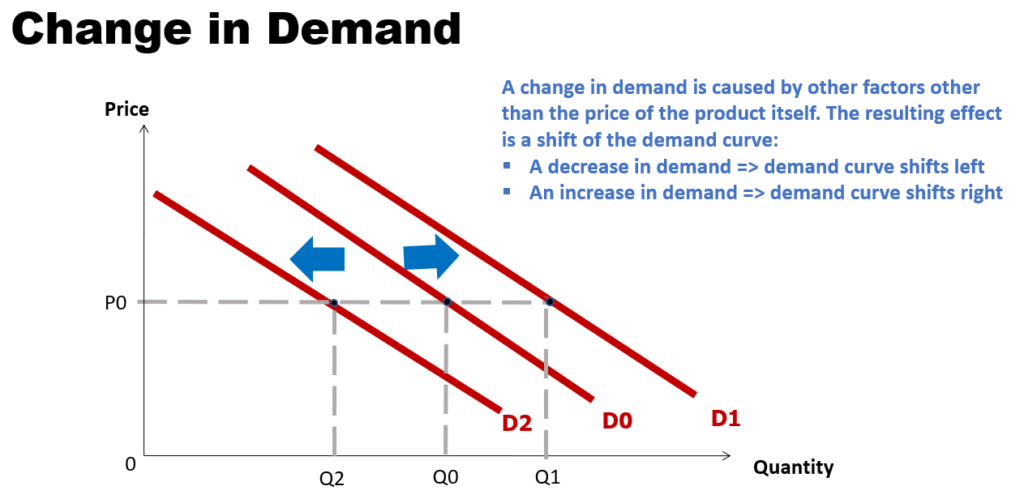
Distinguishing between 'change in quantity demanded' vs 'change in demand'
What can shift the demand curve?
1. Consumer income
An increase in consumer income, the consumption of a particular good will generally increase, hence the curve shifts right. This is true for most goods (i.e. “normal goods”). For “inferior goods” however, higher level of income may result in a decrease of the demand curve.
2. Changes in prices of related goods
a) Complementary goods – these are goods which are used together (e.g. cars and petrol) — when price of one good falls, the demand for the other good increases.
b) Substitute goods– these are goods may be used in place of one another (e.g. coffee and tea) — when the price of one good falls, the demand for the other good decreases.
3. Consumer tastes and preferences
Taste refers to the general preference of a population. Consumer taste and preferences may change based on climatic/seasonal conditions, amount of advertising, and fashion trends.
4. Future expectations
Future expectation of a price change or income change can cause demand to shift today.
5. Number of buyers
An increase in the number of buyers can increase the demand for a good. For instance, this can be due to an increase in immigrants, or increased availability of more markets.