Aggregate Demand and Aggregate Supply (AD-AS) Model
We can combine what we know of the AD curve and AS curve together in a single diagram. This AD-AS model can enable us to analyse changes in real Gross Domestic Product (GDP) and changes in the price level of goods and services. For instance, we can look at how the AD-AS model looks like in different phases of the business cycle — recessionary phase and inflationary phase — and review the different policy interventions needed to bring the economy back to a stable sustainable state conducive for economic growth.
However, the insight from the AD-AS model may vary depending on specific theoretical foundations. Let’s study some of these arguments in the case when the economy is in deep recession.
Classical View - Economy can heal itself

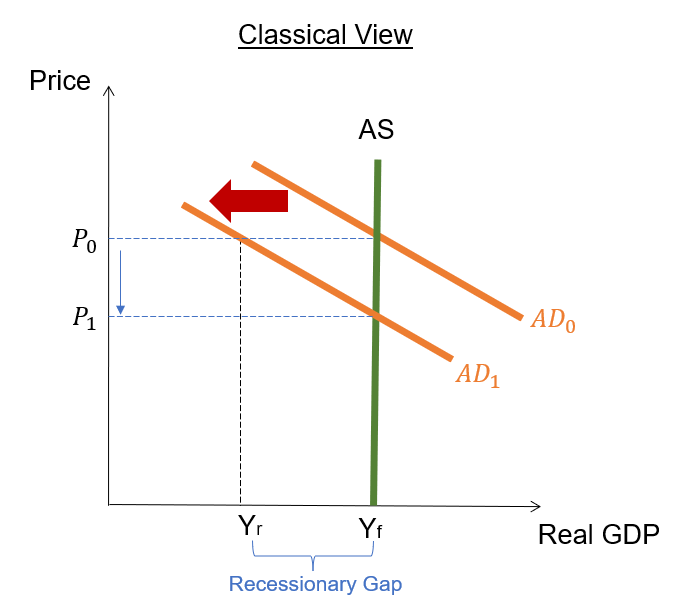
In the (Original) Classical model, the AS Curve is vertical reflecting the prevailing belief that prices of goods and services are perfectly inelastic. This model dates back to the late 1800s. At that time, the economy was experiencing full employment.
According to this model, if an economy that is initially operating at full employment is to suddenly drop into recession (as indicated by a shift in AD curve to the left from AD0 to AD1), then the amount of goods and services supplied at a certain price level would be greater than the actual demand. The GDP will be at Yr, much lower than Yf which is the GDP at full employment.
The difference in GDP (or output) is the recessionary gap (Yf – Yr). In this case, prices will fall (from P0 to P1). At lower prices, the demand of goods and services will increase, closing the recessionary gap.
Hence, in the classical view, the economy is efficient, and it is able to heal itself matching demand and supply, without any need for government intervention.
Keynesian View - Government has a key role to play in managing the economy
The (original) Classical model fell out of favour during 1930s Great Depression, as it could not describe the economic behaviour during that period where there were overwhelming unemployment. Clearly, market forces failed. John Maynard Keynes proposed a new model to explain the economic events at that time.
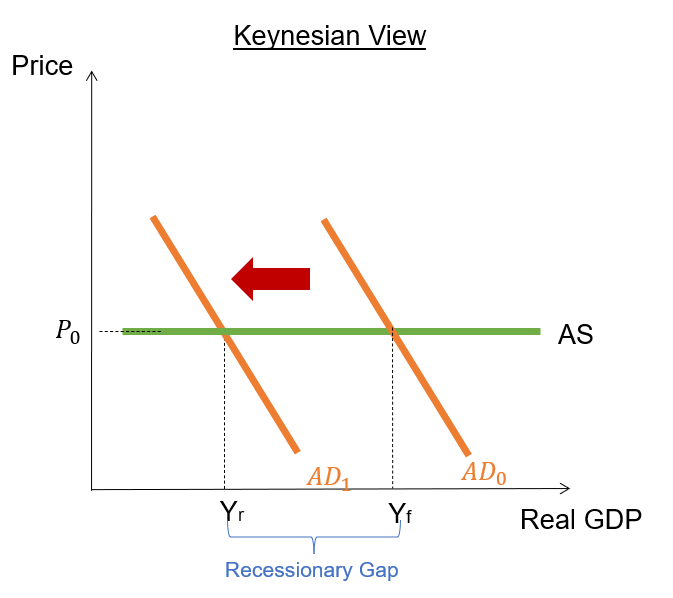
In the (Original) Keynesian model, the AS curve of the AD-AS model is horizontal reflecting the belief that when there is a drop in AD (from AD0 to AD1) such that the economy drops below its full employment level, the prices of goods and services don’t fall because wages and resources prices don’t fall (i.e. wages and prices are ‘sticky’).
Hence, in contrast to the Classical view, Keynesian economists believe that if left alone the economy will not heal itself. It will be stuck in recession, and may either continue to operate at high unemployment rate and producing a low level of output, or even deteriorate further. To bring the economy out of recession, the government has a key role to help increase the aggregate demand. Keynesian economists claim that because the economy is in deep recession, there are a lot of unutilised resources and hence the increase in Aggregate Demand from Government spending would not result in higher prices.

Neo-Classical View - the SRAS will self adjust to the LR equilibrium
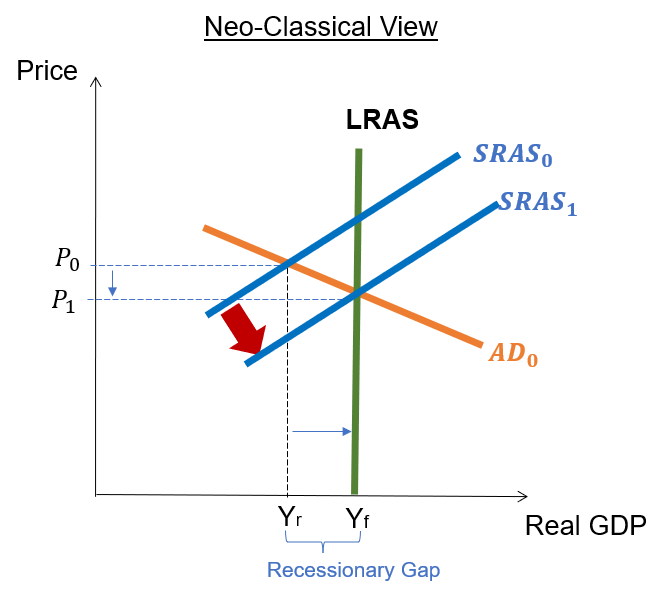
Over the years, there are more data indicating that the AS curve has been upward sloping for most periods. Some economists, called Neo-Classical (or New Classical) economists modified the Classical model to incorporate this as well as other features. The AD-AS model to reflect this view is as shown in the diagram.
If the economy is not operating at full potential, then it is possible that the GDP is lower (at Yr), with higher unemployment as compared to its natural unemployment rate. According to the Neo-Classical economists, wages will fall as most of the unemployed people will eventually settle for lower pay. This means that firms will be motivated to hire more labour as it is now cheaper, hence making the SRAS shifts rightwards from SRAS0 to SRAS1.
Just like the original Classical view, the Neo-Classical model argues that no government intervention was necessary, and the economy will adjust itself. Any deviations from the full employment situation are transient, and given sufficient time, the economy will always adjust back to its Long Run equilibrium at the full employment level.

The 'modern' AD-AS Model - after incorporating various lens

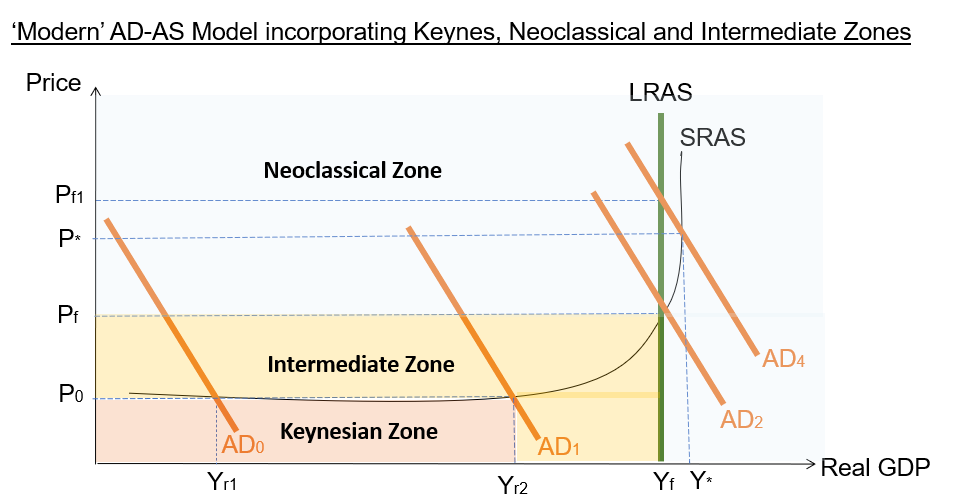
Today, the prevailing Aggregate Demand-Aggregate Supply (AD-AS) model used is a combination of the Neoclassical and Keynesian ideas, with three different zones: (i) Keynesian zone, (ii) Intermediate zone, and (iii) Neoclassical zone.
In the Keynesian zone, the SRAS curve is flat, indicating high unemployment and under utilised resources. Hence, it is possible to increase AD without inflation.
Beyond a certain point, in the Intermediate zone where the SRAS is upward sloping. Here, any AD increase will be accompanied with some inflation. This means that some additional costs will need to be incurred to in order to produce the necessary output to satisfy demand once most of the utilised resources in the Keynesian zone has been used up.
As AD increase further, at or above the full employment level, the economy will be in the Neoclassical zone. The SRAS curve there is vertical. At that point, any further increase in AD will simply result in higher inflation. Since the economy is already operating at its full potential, if someone wants to consume more goods and services than others , he/she will need to pay higher prices to compete with others in order get them.
